Key Stage 4: Statistics
Curriculum Overview
Edexcel 9-1 GCSE Statistics
GCSE Statistics gives students the opportunity to broaden their knowledge in a key component of Maths that is relevant to everyday life. They will develop a core statistical grounding, as well as transferable skills and understanding that is applicable to a range of other subjects. It will also give a deeper understanding of the statistical content in mathematics. It complements subjects such as GCSE Biology, Geography, Business and opens the door to a variety of careers – from weather forecasting to the biological sciences. Statistics is an optional subject which can be chosen to study in Years 10 and 11.
In Statistics we provide students with essential skills and knowledge to prepare them for the next step in their lives, be that further education, training or work. We provide a broad and accessible curriculum with engaging, knowledge-rich subject.
Statistics naturally lends itself to supporting students in their other studies in school, including many links to numeracy and literacy. Statistics develops students ability to interpret and articulate their understanding of data and its every growing relevance within modern society.
Students develop analytical and evaluative skills throughout the statistics course which not only prepare them to be highly successful in GCSE Statistics, but also in the wider world by being able to make justified and informed decisions.
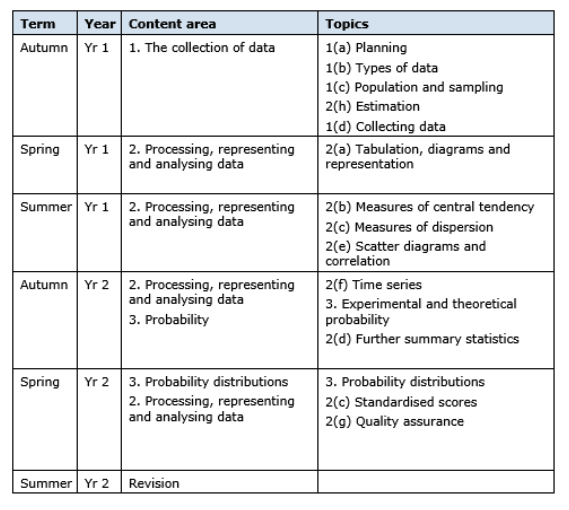
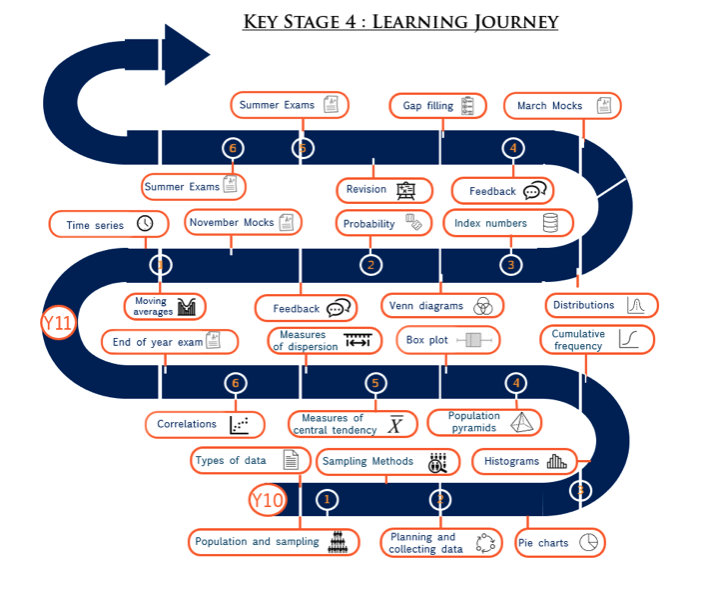
The GCSE course consists of:
Theme 1 – Studied in Year 10 – Assessed by written examination at the end of Year 11
- Describing data
- Populations
- Petersons capture-recapture
- Samling methods
- Collecting data
- Questionnaires and interviews
- Hypotheses
- The data handing cycle
- Tabulation
- Pie charts
- Comparative pie charts
- Stem and leaf diagrams
- Choropleth maps
- Population pyramids
- Histograms and frequency polygons
- Measures of distributions
- Measures of central tendency
- Geometric mean and weighted mean
- Standard deviation
- Boxplots and outliers
- Skewness
- Scatter graphs and line of best fit
- Spearman’s rank correlation coefficient
- Pearson’s product moment correlation coefficient
Theme 2 – Studied in Year 11 – Assessed by written examination at the end of Year 11
- Line graphs and time series
- Trend lines
- Moving averages
- Experimental Probability
- Sample space diagrams
- Venn diagrams
- Tree diagrams
- Conditional probability
- Binomial distribution
- Normal distribution
- Standardised scores
- Quality assurance and control charts